Tools
Log
ESPEasy can output a lot of diagnostics via logs.
There are several output directions where you can send the logs and per direction the log level can be set.
Log Directions
Logs can be sent to:
Syslog - A log collecting service running on another computer
Serial port
Web Log - Visible via the web interface
SD card (only when included in the build)
Syslog
A Syslog service (often called rsyslog) is often standard included in many Linux distributions.
Some How-to:
ESPEasy sends the syslog via UDP to the configured IP-address.
It is also possible to set the Syslog Facility, which allows to set a level to help sort the log messages on the syslog server.
Serial
When configuring to send the logs to serial, all logs will be sent to Serial0. This means you should not use that port for sensors.
The logs will only be sent to the serial port, if under “Serial Settings” the serial port is set to enabled.
N.B. Serial-0 and Serial-0 Swapped are the same port, only configured to use different pins.
Web Log
The Web log is accessible via the web interface via Tools => Log.
To save resources, the buffer for logs sent to the web log is only used as long as the web log page is active. This means that it may initially take some time to see the first log entries and also that it is not possible to see log entries from before the web log page was opened.
SD Card
It is possible to send logs to an SD card. However this is not included in the standard builds by default. The needed libraries for this add a few tens of kByte to the bin size of the firmware, which is why it has been made optional.
Next to the logs, it is also possible to send the task values to the SD card. Please be aware frequent writing to an SD card may wear out an SD card and thus shortens its life span.
Log Levels
There are several log levels. A more verbose level also includes all previous levels.
All log levels sorted by increased verbosity:
None - No logs are generated for the log output direction.
Error - Typical error messages like failed connection attempts or read/write errors
Info - Quite a lot of operational information like new values, time set, etc.
Debug - Typically used to determine a cause for issues.
Debug More - Only used when a bit more detailed information is needed to find the cause of an issue.
Debug Dev - Only used while developing a piece of code. The amount of logs generated at this level is quite overwhelming for a typical setup.
These log levels can be set per output direction.
Please note the most verbose active log level is used to determine whether a log entry should be generated. For the best performance the log level on all output directions should be set as low as possible, since these log entries do take resources like RAM and CPU cycles.
Info
Advanced
Rules Settings
Rules - Check to enable rules functionality (on next page load, extra Rules tab will appear)
Old Engine - Default checked.
Tolerant last parameter - When checked, the last parameter of a command will have less strict parsing.
SendToHTTP wait for ack - When checked, the command SendToHTTP will wait for an acknowledgement from the server.
NTP Settings
Use NTP - Check to query an NTP server for proper system time.
NTP Hostname - When left empty, a random host from pool.ntp.org will be used. (when NTP is enabled)
DST Settings
Define the start and end of Daylight Saving Time (DST)
Start (DST start / CEST) - e.g. Last Sunday of March 2am => 3am
End (DST end / CET) - e.g. Last Sunday of October 3am => 2am
DST - Check to enable DST.
Location Settings
Timezone Offset (UTC +) - Number of minutes offset from UTC. (e.g. +60 minutes for Europe/Amsterdam time)
Latitude - Coordinate (South/North) in degrees.
Longitude - Coordinate (West/East) in degrees.
The coordinates are not used to compute the time zone. They are only used to compute the time of sunrise and sunset.
Log Settings
See Log section for more detailed information.
Syslog IP - IP address of the syslog server.
Syslog UDP port - Port number of the syslog service. (default: 514)
Syslog Log Level - Log Level for sending logs to the syslog server.
Syslog Facility - Specify the syslog facility to send along with the logs. (default: Kernel)
Serial Log Level - Log Level for sending logs to the serial port. (see also Serial Settings below)
Web Log Level - Log Level for sending logs to be viewed on the web log viewer.
SD Log Level - Log Level for sending logs to a SD card (only when included in the build)
Serial Settings
These settings only apply to using the serial port in core ESPEasy functionality, like sending out logs or receiving commands via the serial port.
Enable Serial Port - When unchecked, logs will not be sent to the serial port and commands will not be read from it.
Baud Rate - Baud rate of the serial port. (default: 115200)
Make sure to disable the serial port here when a sensor is connected to Serial0 or the GPIO pins are used for something other then a serial port.
Inter-ESPEasy Network
UDP port used for ESPEasy p2p protocol. When set to 0, this functionality is disabled.
Preferred (and IANA registered) port is UDP port 8266.
See for more detailed information “Controller - ESPEasy P2P Networking”
Special and Experimental Settings
Fixed IP Octet
Sets the last byte(octet) of the IP address to this value, regardless of what IP is given using DHCP (all other settings received via DHCP will be used)
So if you receive 192.168.1.234 from your DHCP server and this value is set to “10”, then the used IP in your node is 192.168.1.10. But since you’re receiving more information from the DHCP server, like subnet mask / gateway / DNS, it may still be useful. This allows a somewhat static IP in your network (N.B. use it with an ‘octet’ outside the range of the DHCP IPs) while still having set to DHCP. So if you take the node to another network which does use 192.168.52.x then you will know it will be on 192.168.52.10 (when setting this value to “10”)
I2C ClockStretchLimit
WD I2C Address
The Watchdog timer can be accessed via I2C. What can be read/set/changed must still be documented.
Use SSDP
Is disabled for now since it is causing crashes. SSDP can be used to help auto discovery of a node. For example Windows uses it to find hosts on a network.
Connection Failure Threshold
Number of failed network connect attempts before issuing a reboot (0 = disabled) A side effect is that trying to reach some server which is offline, may also result in reboots of the ESP node.
Force WiFi B/G
Force the WiFi to use only 802.11-B or -G protocol (not -N) Since the 802.11 G mode of the ESP is more tolerant to noise, it may improve link stability on some nodes.
Restart WiFi on lost conn.
Force a complete WiFi radio shutdown & restart when connection with access point is lost.
Force WiFi no sleep
This option will set the WiFi sleep mode to no sleep. This may cause the node to consume maximum power and should only be used for testing purposes. It may even lead to more instability on nodes where the power supply is not sufficient or the extra heat cannot be dissipated.
Since changing the mode back to the default setting may lead to crashes in some core versions, this option is only enabled when starting the node. To activate a change of this setting, a reboot is required.
Periodical send Gratuitous ARP
The ESP node may sometimes miss ARP broadcast packets and thus not answer them if needed. This may lead to the situation where a packet sent to the node cannot be delivered, since the switch does not know how to route the packet. To overcome this, the ESP node may send a Gratuitous ARP packet, which is essentially an answer to a request which hasn’t been made. These gratuitous ARP packets however may help the switch to remember which MAC address is connected via what port.
By default the ESP will send out such a gratuitous ARP packet every time it receives an IP address and also when it was unable to make a connection to a host. It could be the other host was replying, but the packet was not routable to the ESP node.
This Periodical send Gratuitous ARP option will send these kind of ARP packets
continuously with some interval.
This interval is defined in the source code in TIMER_GRATUITOUS_ARP_MAX (e.g. 5000 msec)
CPU Eco mode
Will call delay() from scheduler during idle loops. This will result in a significant energy reduction of up-to 0.2 Watt.
However, it is no guarantee the power consumption will be reduced. For example when the host is receiving continuous ping requests, it will never activate the power save mode.
If the power save mode is active, the node may miss some broadcast packets. For example the ESPeasy p2p packets will be missed every now and then, so do not activate this mode when response time on received packets is important.
If the node is only sending packets (e.g. only a sensor connected and sending to some server), then this is a great way to save energy and also reduce heat.
Show JSON
Timing Stats
The timing stats page is a diagnostics tool to help pinpoint possible causes for issues a user may experience.
Throughout the code timing statistics are collected. These can be represented in one big table with these columns:
Description - Name of the function/plugin/controller being monitored
Function - For plugins and controllers, the function call of that item
#calls - Number of times seen.
call/sec - Number of calls per second.
min (ms) - Minimum duration in msec.
Avg (ms) - Average duration in msec.
max (ms) - Maximum duration in msec.
Please note that every time the timing stats page is loaded, the statistics will be reset. So the statistics in the table reflect the period mentioned at the bottom of the page.
Interpret Statistics
All timing values over 100 msec will be marked in bold. To further help pinpoint some of these extremes, any row containing a bold timing is also given a green hue.
These are just some indicators where actions may take longer than optimal, but it should not be considered as faulty when some value exceeds 100 msec. Sometimes there is a perfectly fine explanation, like when a host is contacted on the other side of the globe.
Some function names give a good indication on how frequent they should be run.
For example FIFTY_PER_SECOND or TEN_PER_SECOND should be run at 50x/sec, resp. 10x/sec.
If these values differ substantially, something may be keeping the unit occupied.
Please note that if multiple instances of the same plugin are active, the number of calls per second should also be higher.
Also the number of samples should be large enough to be able to be useful.
For example if the ONCE_A_SECOND function is only observed once over a time interval of 1.99 second, it will be shown as a frequency of about 0.5 calls/sec.
That would seem much less than expected, but it fact it is perfectly fine.
As noted, it is to be preferred if no scheduled action on the node takes over 100 msec. Some plugins, like OLED Framed may take more to update the display. Especially when scrolling is enabled.
But for other plugins it may deserve some attention if a plugin (almost) always takes over 100 msec to perform an action. For example when minimum, average and maximum timing values are very close to each other, then there may be reason to look into the plugin (or controller) to see if things can be improved.
For stable WiFi connection, every now and then a call to yield() or delay() should be made.
The time between such calls should be less than 10 msec.
So if some code execution does take longer than 10 msec, it must also make sure to call yield() every now and then.
When some entries in the timing stats happen frequently and take over 100 msec, then they will for sure affect other plugins and controllers active on the same node. This is also a very good reason to try and keep the timing stats values as low as possible.
Typical Outliers
Some of the timing stats are “nested”.
For example the loop() function is probably the row with the largest maximum timing value, since all other functions are called from the loop.
The same applies for the two handle_schedule() functions. These either call scheduled actions to do, or things to be done when idle.
Both the loop() and the handle_schedule() functions are called very often.
Given enough time, their count value will be high, or even overflow since they are a 32-bit integer.
When this happens, the values for calls/sec or avg will be no longer useful.
A really busy node (CPU load > 75%) may drop a few scheduled calls in order to keep up.
This will be noticable in low values for calls/sec of the most frequently called functions like FIFTY_PER_SECOND or TEN_PER_SECOND.
Tweaking Timeout using Timing Stats
As an example to tweak timing settings, take the time needed of one of the active controllers. Lets assume the average time needed to contact such a controller is 30 msec. Then it does not make sense to have the client timeout of that controller set to 1000 msec. 2x - 3x the average time is often a perfectly fine value to use as a timeout.
System Variables
Factory Reset
Sometimes it can be useful to start over with a fresh setup. The Factory Reset allows just that, and more.
Format flash filesystem (so called SPIFFS)
Re-create new settings files
Already store some existing values to keep
Allow for some pre-defined module config
Pre-defined module configurations help to setup the following:
GPIO connected to button => plugin switch configured
GPIO connected to relay => plugin switch configured
If there is a conflict with default I2C pins, then those are set to no pin assigned for I2C
Status LED GPIO
Added rule to combine button and relay.
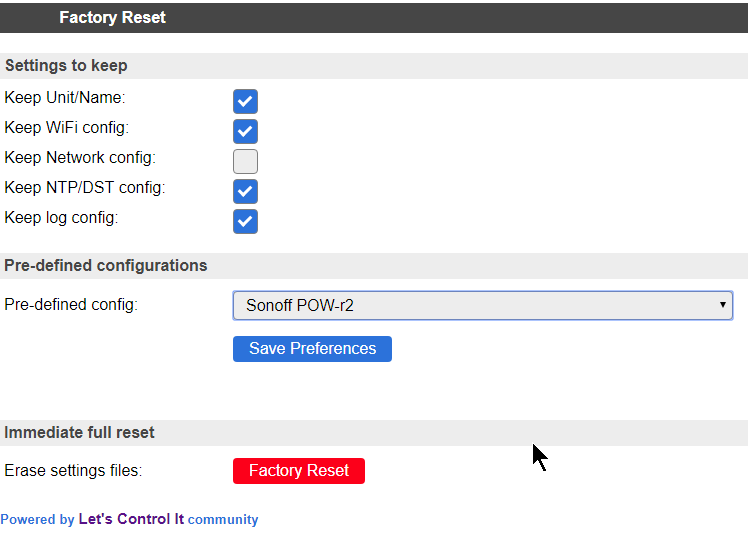
Only pre-defined options for modules will be enabled for selection when they match the detected flash chip size. For example, the Sonoff POW modules will not be selectable on a module with 1 MB flash and the Sonoff Basic cannot be selected on a board with 4 MB flash.
Warning
Pressing the red “Factory Reset” button will immediately perform the reset with the set selection.
Settings Archive
(Only available for core 2.5.0 and newer)
ESPeasy does not support an “undo” when it comes to settings. Also cloning the settings of a node can be a lot of work.
The Settings Archive is an initial step to help cloning settings or reverting to an older version of the settings. To revert to an older version, one still has to have a backup of the settings stored on some server which is accessible via HTTP.
Later the (automatic) upload of settings will be added, including encryption.
Download Settings
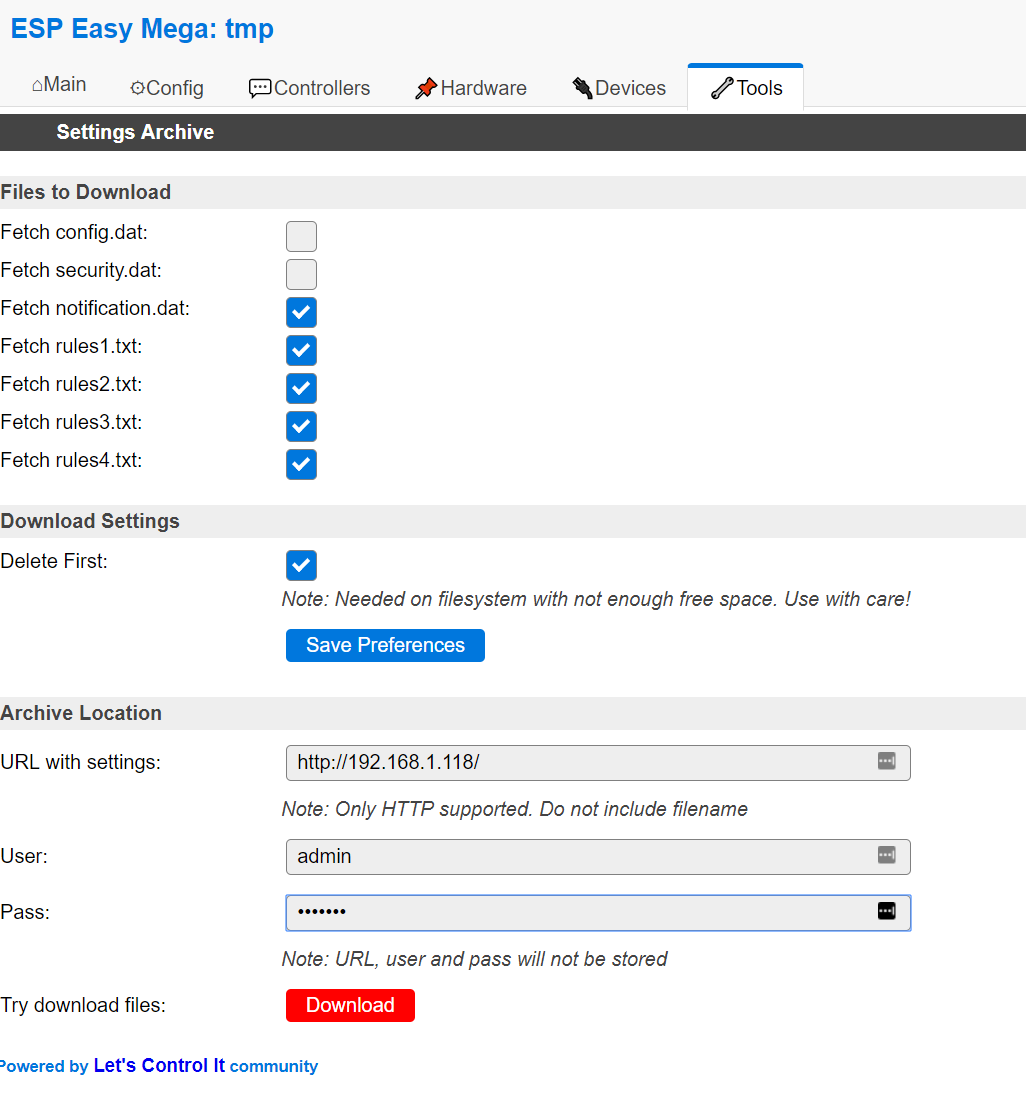
In order to download settings files, one has to select which ones to download and from where. In the example shown here, the notification settings and rules were cloned from another ESPeasy node. This other node is protected using a login, just to show basic authentication is also allowed.
Due to the needed memory resources, it is not possible to download from HTTPS. This also meand the settings file and credentials are sent in plain text. So do not use this to download settings with sensitive information directly from the internet.
On some nodes the remaining free space on the SPIFFS filesystem may be too small to keep the original file and a downloaded version. For example on 1MB nodes, there is only 120k SPIFFS, which means it is not possible to have the ‘’config.dat’’ file stored twice on the filesystem.
For these, the “Delete First” checkbox should be used. But be aware that the file is deleted first, even if the host holding the files to download is unavailable.
Better try first with a smaller file on such nodes. Especially if the node is hard to reach for a proper clean setup.
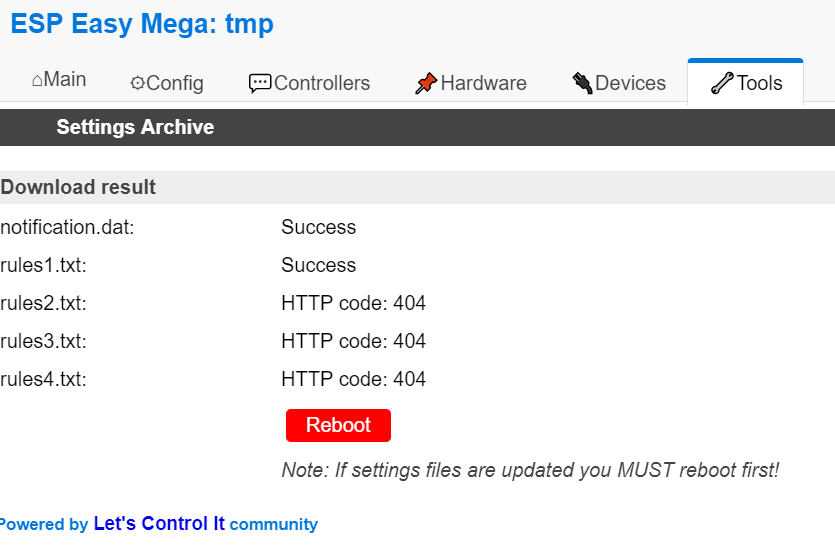
After downloading the files, a summary is given. A returned error can be something like 404 (file not available) or 401 (not authorized). These are the standard HTTP error codes.
If ‘’config.dat’’ or ‘’security.dat’’ was downloaded, it is very important to do a reboot and not try to change (and save) anything on the ESPeasy node. The old settings are still active in memory and if something will be saved, only the changed part may be saved. This would corrupt the settings file.
Side Effects on cloning
Please note that cloning settings from another node may have some side effects. For example the host name and unit number will be the same. But also the controllers will be active and may start sending incorrect data.
Controller credentials may also be used on multiple nodes, which may also lead to various issues.
If the original node is configured to use static IP, the clone will use the same IP address. This can render both inaccessible.